User Interface
This is a description of individual UI components and their usage.
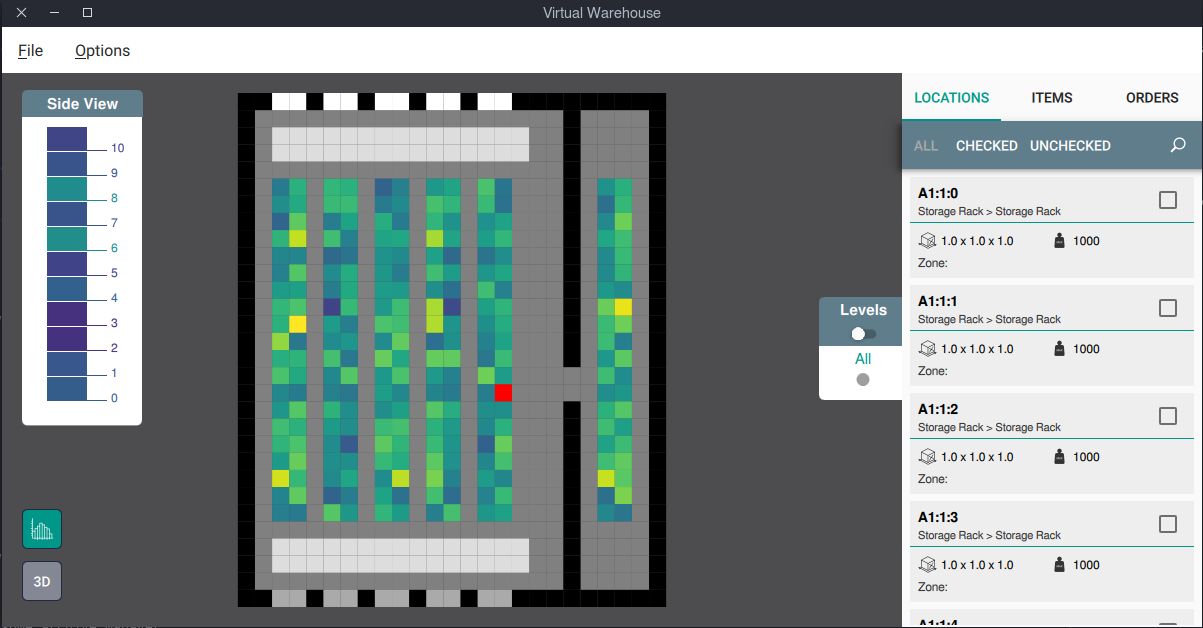
Application screenshot (heat map view)
Main View
The main view displays a visualization of a loaded warehouse. In the bottom left corner is an option to switch between 2D (top-down) view and 3D view. For 2D view, there is also an option of displaying a heat map based on order frequencies.
Heat Map
Calculates order frequencies for individual items. Location frequencies are then estimated based on item frequencies at the location. For visual separation of different frequencies, Viridis color scale is being used.
There are two different modes of the heat map. Selection between these modes is controlled by the toggle button and value slider at the right side of the main view.
All levels - calculating the frequency as a sum of all levels at the location.
Separate level - calculating the frequency based on a selected level.
Side View
For the 2D view, a side view can be displayed. The side view shows vertical separation (individual levels) of a location under the mouse cursor. If no location is hovered, a selected location is displayed in the side view. Levels are colored based on the heat map calculated for individual levels.
Sidebar
The sidebar is located on the right side of the application. It is made out of 3 tabs:
Locations
Items
Order
Each tab displays a list of corresponding elements. There is also an option of filtering the elements by the status of their checkbox or search using the search bar. The search bar looks for substring match in element ID.